
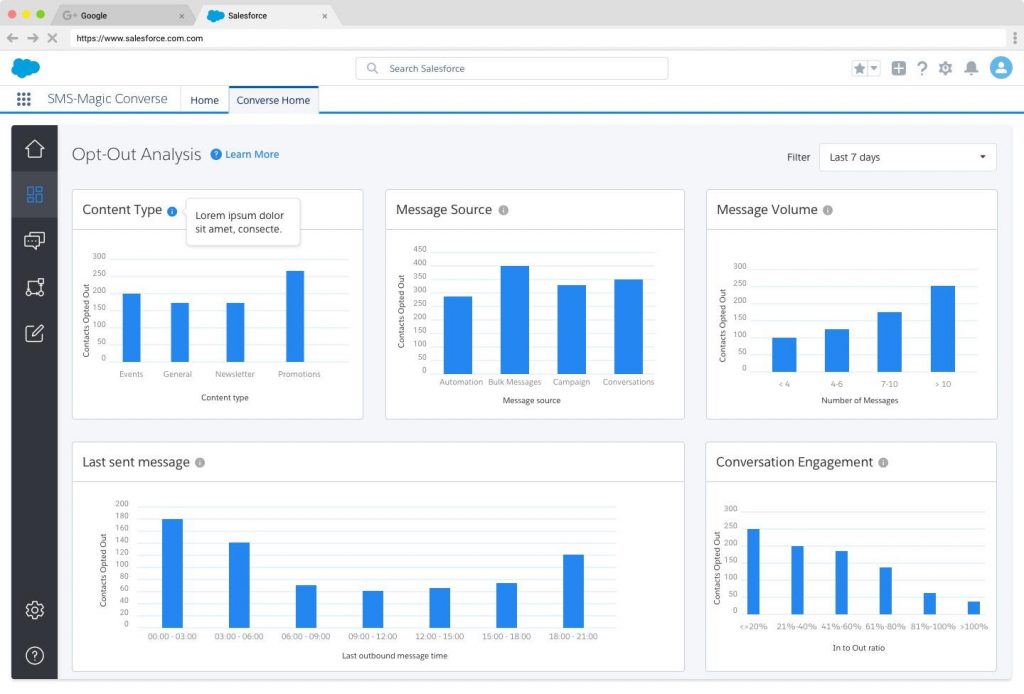
Opt-Out Analysis
The Opt-out Analysis dashboard shows the analysis for opted out numbers based on different dimensions, such as numbers opting out from different types of content, messaging sources, etc. The displayed data is not real-time. It is last updated based upon the batch processing schedule time that you have configured.
a. Filter
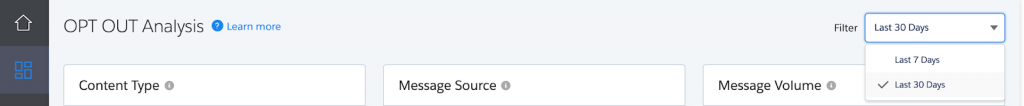
It is a top-level filter to handle the analysis date range. The filter is on ‘date opted out’ i.e. all the further analysis is done on the records where opted out date is within the filter date range.
The current version supports two filters:
- last 7 days
- last 30 days
b. Content Type
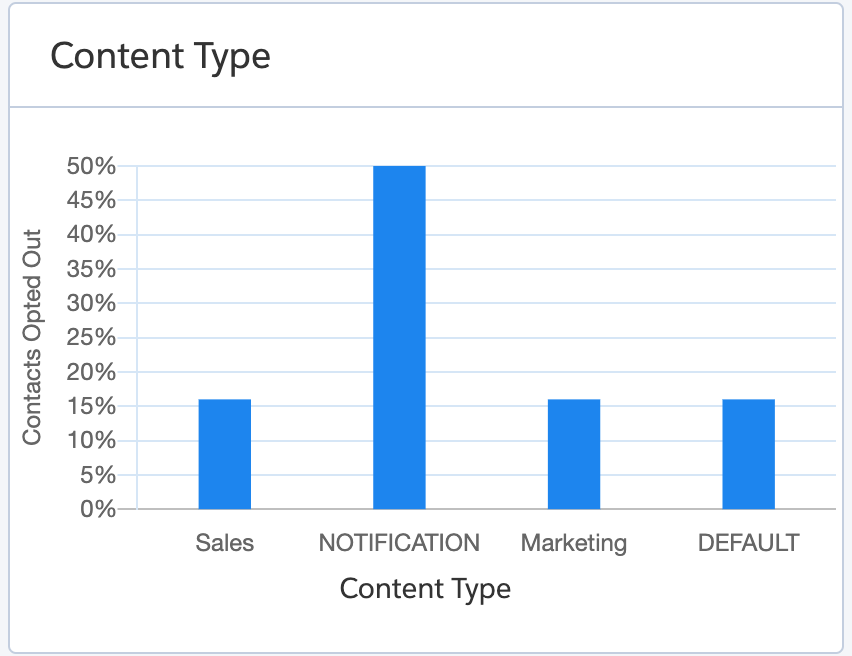
It is a graphical representation of the percentage of contacts opted out for each of the content types. The percentage of the contacts opted out is calculated as follows:
Contacts opted out = [Count of phone numbers opted out during the date range]/[Count of phone numbers opted in till the date range]*100
E.g. Filter range selected as 30 days (1st June-30th June). During this date range for sales type of content, 150 contacts opted-out. As of 1st June, 1000 numbers were opted-in. Based on the above formula,
Contacts opted out = [150/1000]*100= 15%
c. Message Source
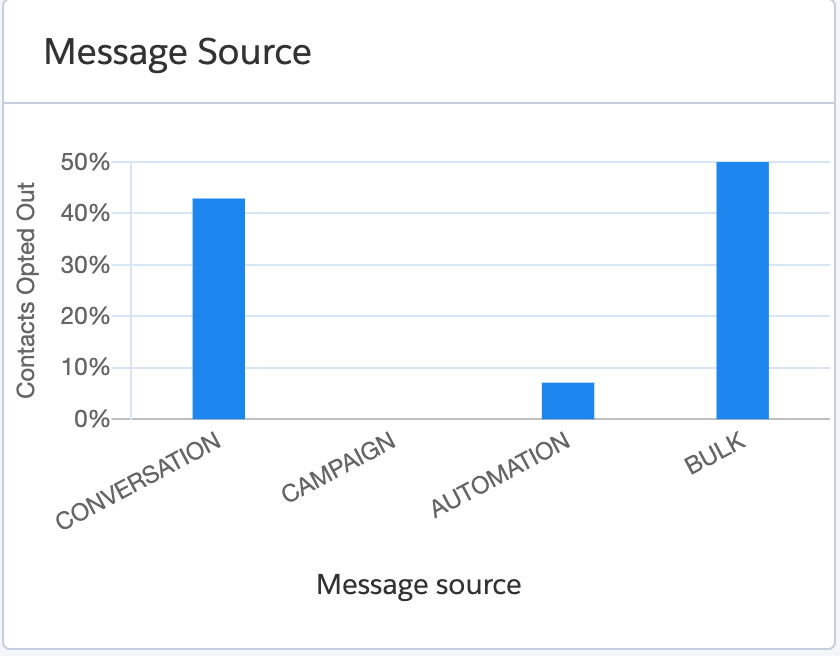
It is a graphical representation of the percentage of contacts opted out for each of the message sources. (The percentage of the contacts opted out is calculated same as above in 2.b.)
d. Last Message Sent
It is a graphical representation of the percentage of contacts opted out and the time slots for the last sent messages. These time slots indicate the preferred time of your customers to receive messages. Typically people don’t like to receive messages during the late evening and early morning (The percentage of the contacts opted out is calculated the same as above in 2.b.)
e. Message Volume
It is a graphical representation of the percentage of contacts opted out and the number of messages sent. These time slots are important to understand the number of messages sent to your customers. Typically people don’t like to receive frequent messages. (The percentage of the contacts opted out is calculated same as above in 2.b)
f. Conversation Engagement
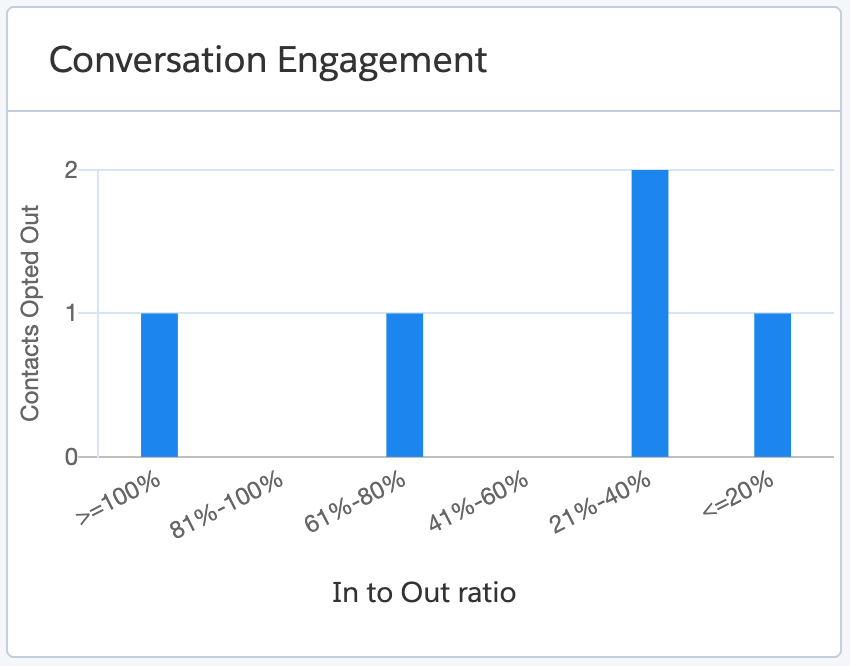
It is a graphical representation of the percentage of contacts opted out and the number of messages. Grouping is done based on the conversation ratio bucket.
In to Out Ratio = number of incoming messages/ Number of outgoing messages
(The percentage of the contacts opted out is calculated same as above in 2.b)