Overview
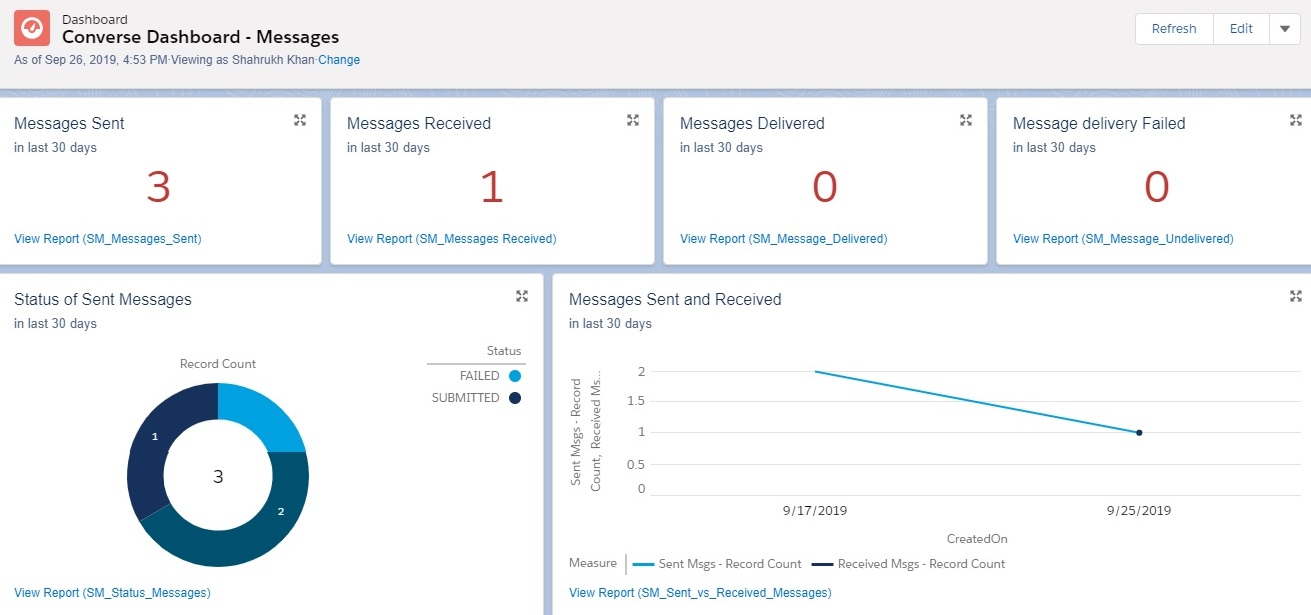
You need to monitor messages that are sent as well as received in order to track their status. This helps you understand the actual count of messages that have successfully reached your customers. When the volume of messages being sent and received is significantly large, it is difficult to keep a track manually. It is therefore important that you generate reports from the data provided and conduct intelligent analysis to help you gain the right insight.
SMS-Magic Converse provides Dashboards that help you view the analytics generated from the message volume. The reports displayed on each dashboard provide a graphical view of the data to help in easy comprehension. They are sufficiently detailed covering every aspect of your messaging strategy.
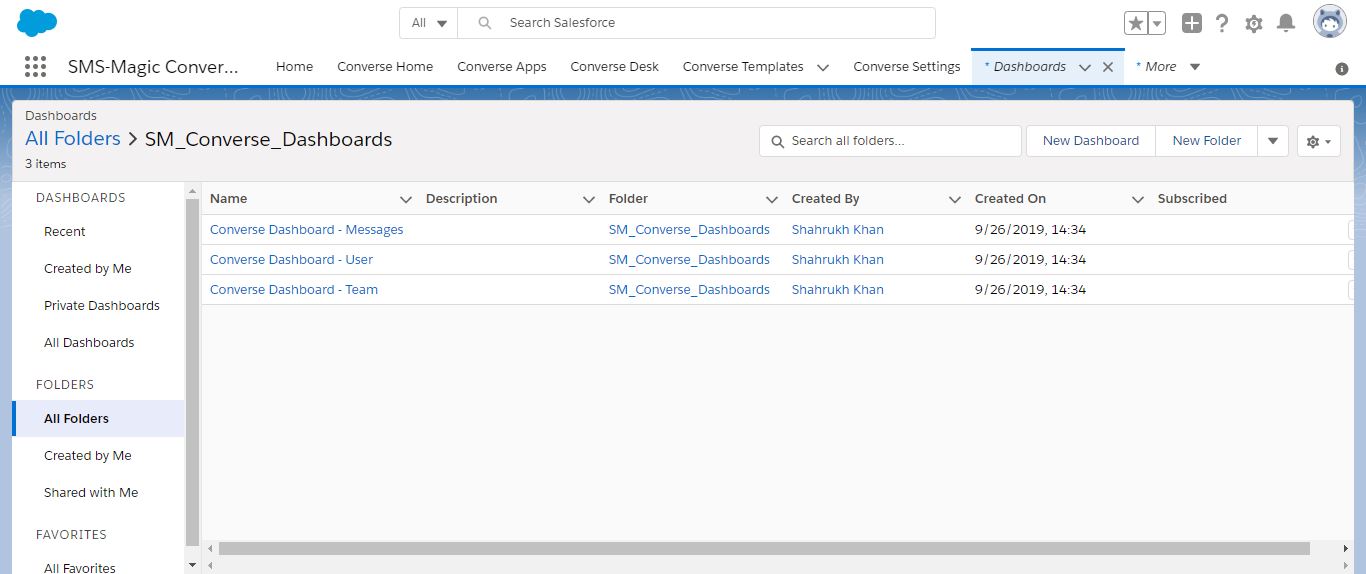
There are three dashboards provided to address the needs of users and managers:
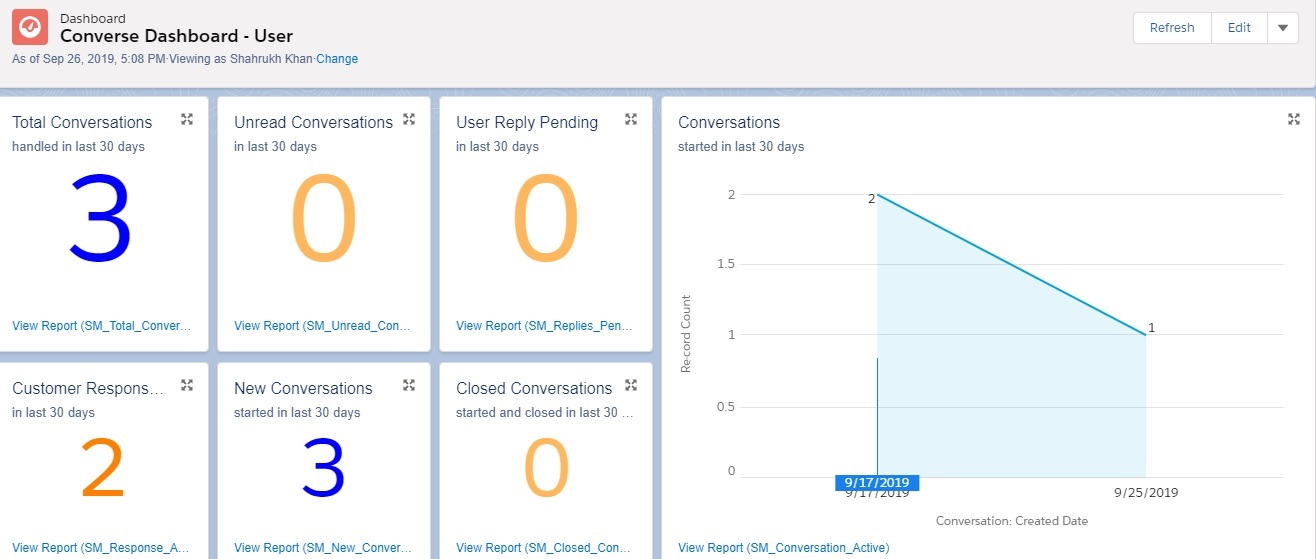
- Converse Dashboard – User
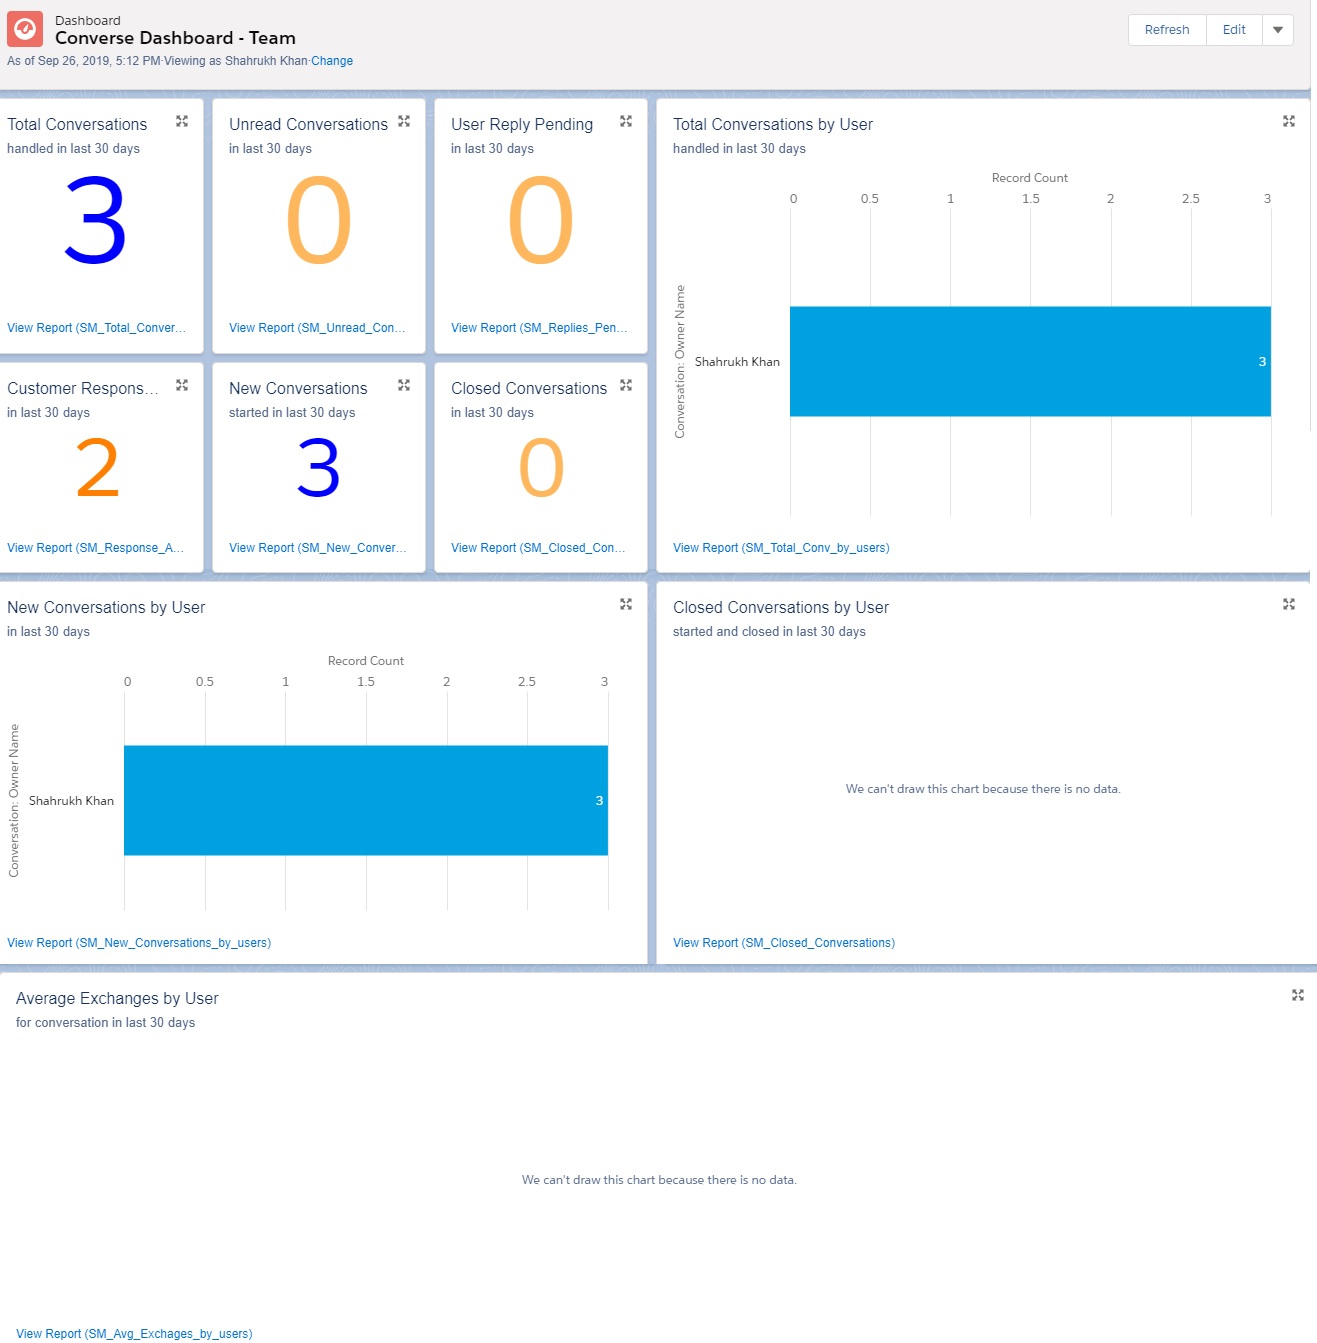
- Converse Dashboard – Team
- Converse Dashboard – Messages
Each dashboard comprises widgets that contain a minimum of one report. Reports display data collected over the last 30 days for individual Users as well as Managers. If you are a manager, you will be able to view reports for your entire team. Moreover, the same report may be used in multiple widgets to display more detailed analysis, if required.
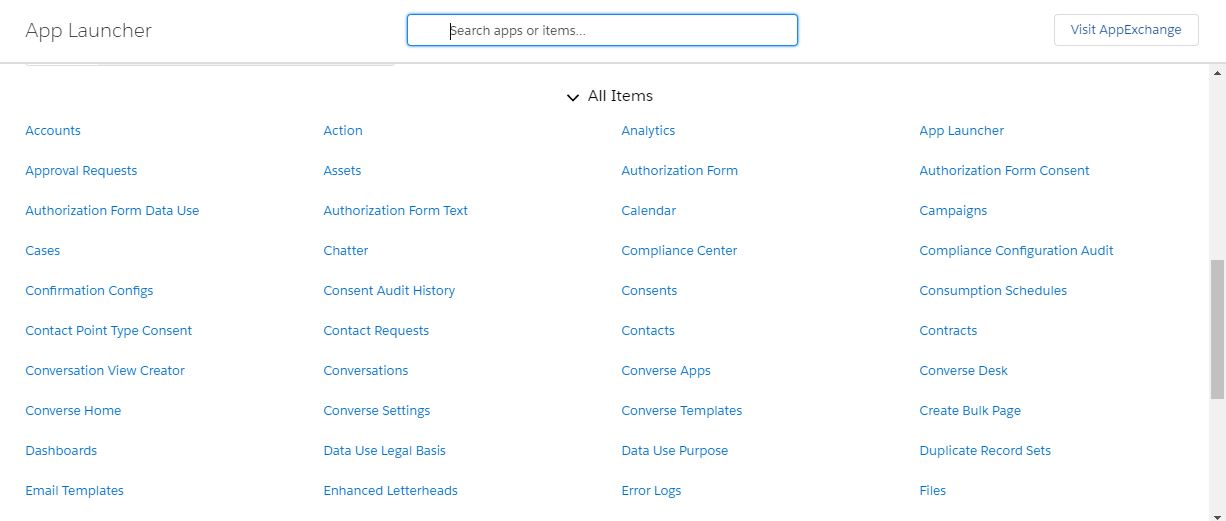
The Converse Dashboards are installed once the app installation is completed. All Reports will be automatically downloaded once the installation is complete.
 to expand reports