1

Consent Status

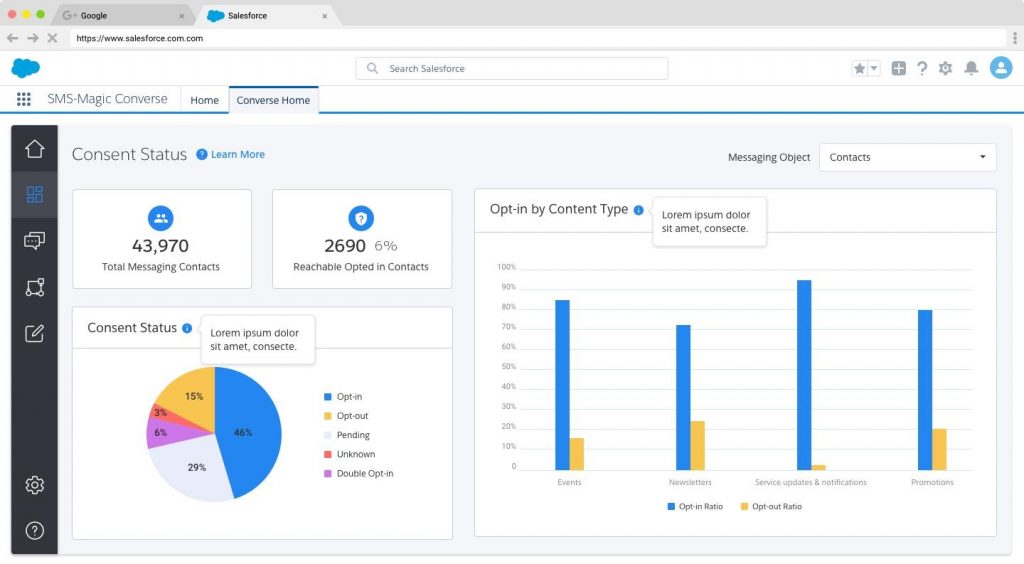
The Consent Status dashboard displays the overall consent status at the org level. It shows the number of known contacts against configured messaging objects who have provided the consent to receive messages. The displayed data is fetched in real-time. 

a. Messaging Object

It is a top-level filter based on the MoC set during the SMS-Magic Converse app setup. The list of all ‘Primary MoC’ will appear in the dropdown.

b. Total Messaging 

Based on the filter selected as the messaging object, the total messaging dashboard will indicate the name as Total Messaging <Messaging Object>’, and will display the ‘count of unique records’ in the Salesforce org.

E.g. Here, in the image, the Messaging Object is selected as a contact object, and 43,970 is the count for the number of messaging contacts.

c. Reachable Opted-in dashboard

Based on the filter selected as the messaging object, the ‘Reachable opted in’ dashboard, will indicate the name as ‘Reachable Opted in <Messaging Object>’, and the ‘count of unique records with consent’, i.e number of opt-in in the Salesforce org.

E.g. in the image, the count for reachable opted in contact object is 2690, also expressed in percentage i.e. 6%.

d. Consent Status dashboard

Based on the filter selected as the messaging object, the Consent Status dashboard will show a pie chart depiction of the consent status for opt-in, opt-out,  pending, unknown, and double opt-in. The total of all the numbers sum up to 100%.

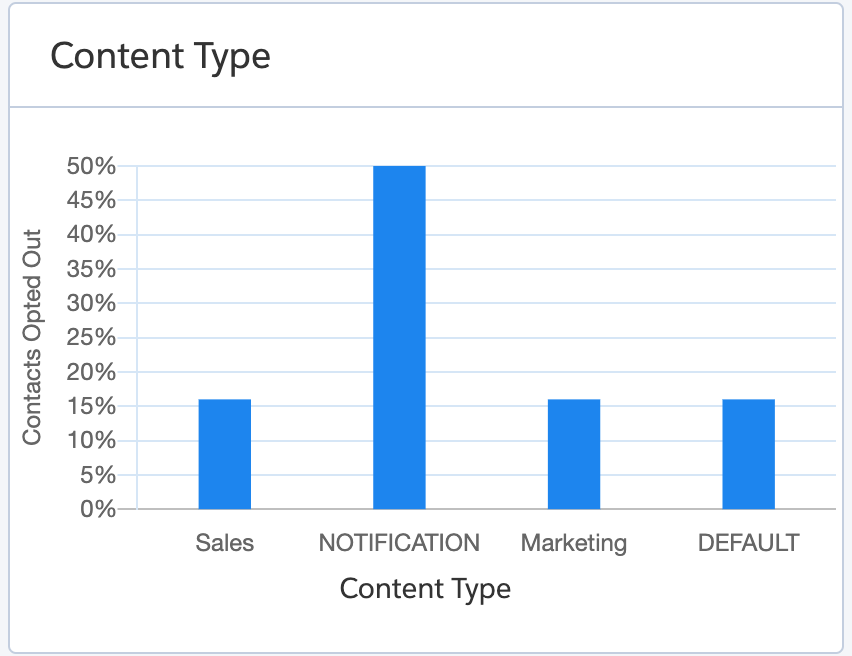
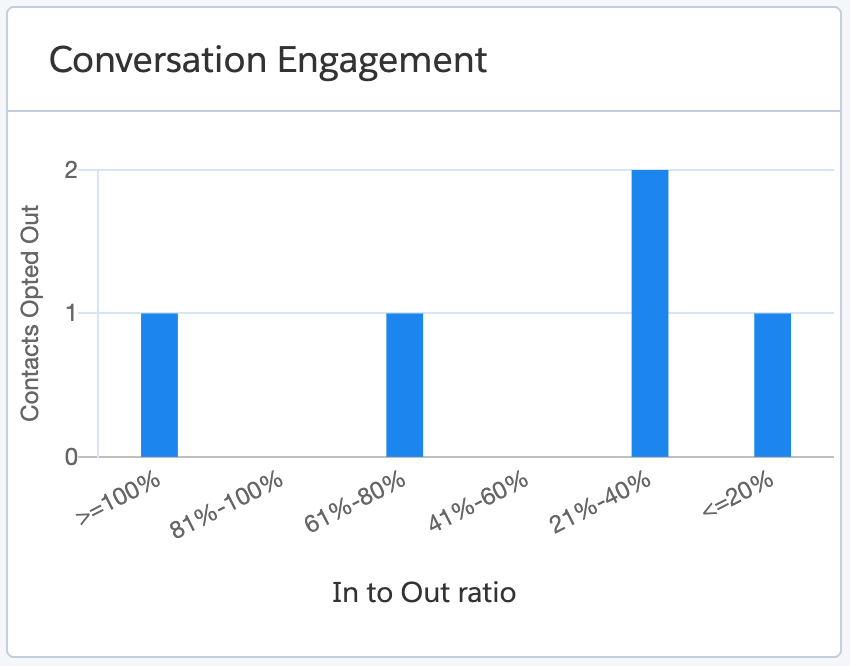
e. Opt-in by Content type

Based on the filter selected as the messaging object, the chart indicates the ratio of opt-in to a total number of contacts and opt-out to a total number of contacts. The sum of opt-in and opt-out for a content-type cannot exceed 100%.

Notes: When there are more than 5 content types, the dashboard will show top 4 types based on total consent record count, and club all others together in the last legend on the chart as ‘Others’


Opt-Out Analysis

The Opt-out Analysis dashboard shows the analysis for opted out numbers based on different dimensions, such as numbers opting out from different types of content, messaging sources, etc. The displayed data is not real-time. It is last updated based upon the batch processing schedule time that you have configured.

a. Filter

It is a top-level filter to handle the analysis date range. The filter is on ‘date opted out’ i.e. all the further analysis is done on the records where opted out date is within the filter date range.

The current version supports two filters: 

  1. last 7 days
  2. last 30 days

b. Content Type

It is a graphical representation of the percentage of contacts opted out for each of the content types. The percentage of the contacts opted out is calculated as follows:

Contacts opted out = [Count of phone numbers opted out during the date range]/[Count of phone numbers opted in till the date range]*100

E.g. Filter range selected as 30 days (1st June-30th June). During this date range for sales type of content, 150 contacts opted-out. As of 1st June, 1000 numbers were opted-in. Based on the above formula,

Contacts opted out = [150/1000]*100= 15%

c. Message Source

It is a graphical representation of the percentage of contacts opted out for each of the message sources. (The percentage of the contacts opted out is calculated same as above in 2.b.)

d. Last Message Sent

It is a graphical representation of the percentage of contacts opted out and the time slots for the last sent messages. These time slots indicate the preferred time of your customers to receive messages. Typically people don’t like to receive messages during the late evening and early morning (The percentage of the contacts opted out is calculated the same as above in 2.b.)

e. Message Volume

It is a graphical representation of the percentage of contacts opted out and the number of messages sent. These time slots are important to understand the number of messages sent to your customers. Typically people don’t like to receive frequent messages. (The percentage of the contacts opted out is calculated same as above in 2.b)

f. Conversation Engagement

It is a graphical representation of the percentage of contacts opted out and the number of messages. Grouping is done based on the conversation ratio bucket.

In to Out Ratio =  number of incoming messages/ Number of outgoing messages

(The percentage of the contacts opted out is calculated same as above in 2.b)


Compliance Enforcement Stats

This dashboard will show you the compliance enforcement metric displaying how many times it stopped messages being sent to opted-out numbers and what it means in monetary terms.

a. Filter

It is a top-level filter to handle the analysis date range. The filter is on ‘message sent date’ i.e. all the further analysis is done on the records where the message sent date is within the filter date range.

The current version supports two filters: 

  1. last 7 days
  2. last 30 days

b. Messages Sent

This section of the dashboard shows the analysis based on the sent/outgoing messages.

  • Messages Sent – Shows the total count of outgoing messages that includes the number of sent and blocked messages due to opt-out consent.
  • Blocked for opt-out – Shows the total count of blocked messages from going out of Salesforce as there was an opt-out consent present against the recipient phone number. The percentage representation is a ratio of blocked messages to total sent messages.

c. Unique Numbers Contacted

 This section of the dashboard shows the analysis based on the sent/outgoing messages.

  • Contacts Message – Shows the count of phone numbers to which outgoing messages were sent. This means the count of all the unique numbers on which the outgoing messages were attempted. It includes all the unique opt-out contacts as well.
  • Blocked for opt-out – Shows the total count of  unique phone numbers to which outgoing messages were blocked due to their opt-out consent.

d. Consent Breach Avoided- Content Type

For every content type the ratio of “blocked outgoing messages” to “total messages sent” is displayed in org column and the ratio of “successfully sent messages” to “total messages sent“ is displayed in the blue column. The total volume of outgoing messages (blocked + actually sent) as Data Points (Stars) on the secondary Y-axis. 

e. Consent Breach Avoided

When an outgoing message is blocked due to opt-out, it’s a “Consent Breach Avoided”.

For every number where consent breach is avoided is counted and grouped based on the number of times of the consent breach is avoided.

E.g. for a number x, which opted-out, yet if you tried to send the message to the same number twice. Both the messages would be blocked due to opt-out consent. Thus the consent breach is avoided two times. The number x is now counted as part of the second column (‘Second time’) of the graph.


Agent Productivity

a. Filter

It is a top-level filter to handle the analysis date range. The filter is on conversation and SMS history ‘record creation date’ i.e. all the further analysis is done on the records where the record creation date is within the filter date range.

  • Metrics with conversions filter are: Active Conversations, Conversations Initiated, Conversations Unassigned, Response Pending and Reply Pending 
  • Metrics with SMS History filter are: Response time, Reply Time and Response Rate

Current version supports two filters: 

  1. last 7 days
  2. last 30 days

b. Conversation status

All the measurements under this are based on the Conversations.

  • Active Conversations – The count of conversations where at-least one inbound or outbound message is present for the filter date range.
  • Conversations Initiated – The count of conversations having created in the selected filter date range.
  • Conversations Un-assigned – The count of conversation that are not assigned to any user

c. Customer Responses

All the measurements under this are based on the Conversations.

  • Response Pending – The count of conversations where the last message as an outgoing message in the filter date range and conversations status is ‘Not Closed’
  • Response Time – The response time is defined as the time elapsed between an outgoing and an incoming message. Response time is measured for every OUT to IN pair only.
  • Response Rate -The ratio of incoming and outgoing messages for all conversations.

d. Rep Replies

  • Reply Pending – The count of active conversations where the last message as an incoming message and conversations status is ‘Not Closed’
  • Reply Time – Reply time is defined as the time elapsed between an incoming and an outgoing message. Reply time is measured for every IN to OUT pair only. Average reply time is average for all such pairs across all the conversations where both IN and OUT messages in the pair are in the filter date range.

e. Rep Engagement Table

All the measurements collected and shown in the table below are aggregated. The same measurements are filtered based on the owner of the conversation and represented in tabular format. Star rating against a value is based on best performance as Most Active Conversations, Least Rep Reply Pending, Least Rep Reply Time, Least Customer Response Pending, Least Customer Reply Time.