Overview
The Message Delivery Dashboard is built for quick access to statistics and information related to messages sent and received. This helps in keeping a track of all messages in one place with visual depictions and statistical information.
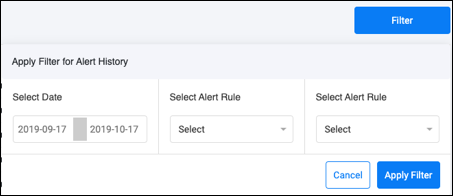
The information in the Dashboard can be filtered using the filter drop-down as shown below:
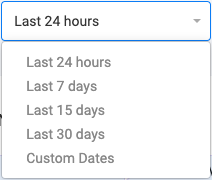
| FILTER | DESCRIPTION |
| Last 24 Hours | Displays hourly information for the last 24 hours |
| Last 7 Days | Displays daily information of the last 7 full days |
| Last 15 Days | Displays daily information of the last 15 full days |
| Last 30 Days | Displays daily information of the last 30 full days |
| Custom Dates | Displays information as per date range set |
There are 6 different widgets in the Dashboard:
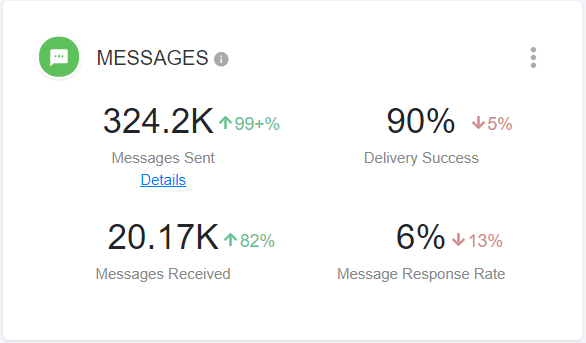
- Messages
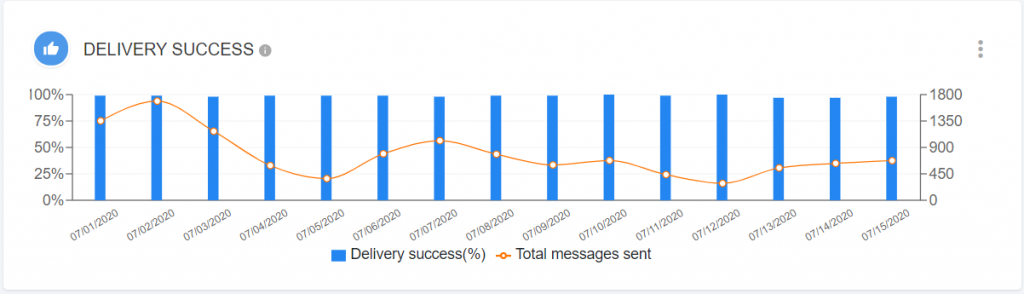
- Delivery Success
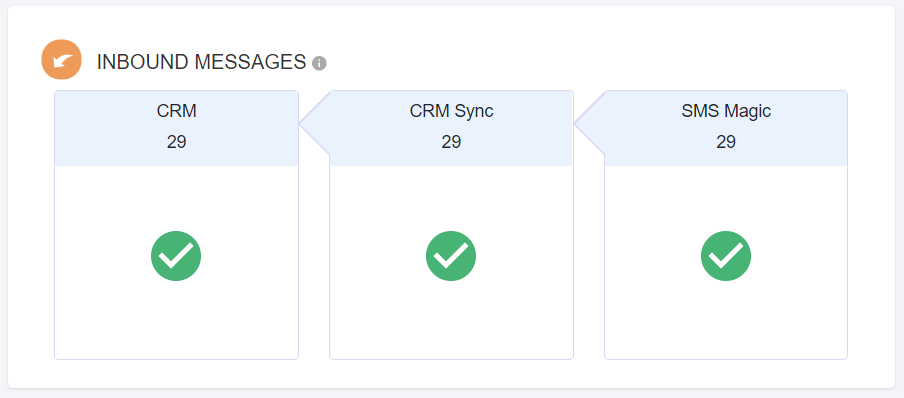
- Inbound Messages
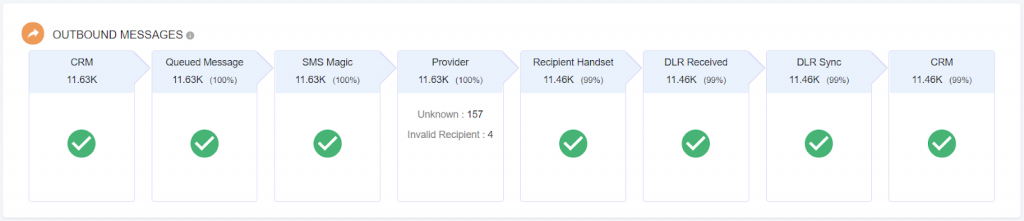
- Outbound Messages
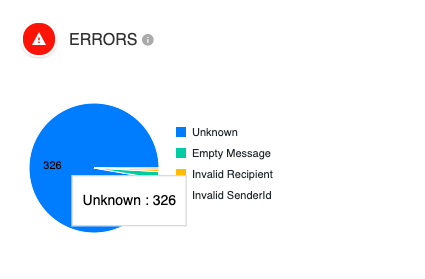
- Delivery Errors
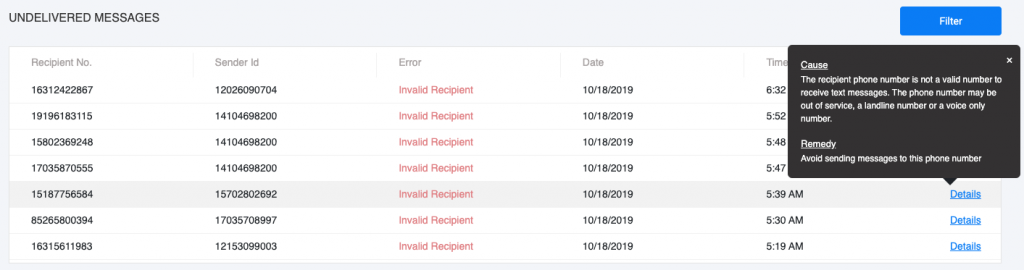
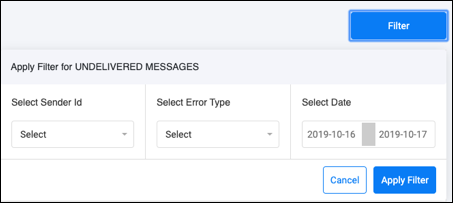
- Undelivered Messages